
An old accounting joke goes:
CLIENT (pointing towards a pile of papers): How much does this add up to?
ACCOUNTANT: What would you like it to add up to?
Business managers and investors don’t always see eye to eye, especially about keeping accounting transparent.
So you’ve got to dig deeper into numbers to spot problematic companies. With that in mind, we hope to add to your analytical toolkit with this post. We’ll talk about companies that don’t depreciate their assets fast enough, which inflates profits, bloats balance sheets, and leads to write-offs.
They do this by stretching useful lives, an aggressive accounting practice. They have assets that live too long.
Sneak peek: Our analysis shows that returns tend to get worse with higher levels of useful life.
Useful lives = how long they expect assets to last
A quick recap of how depreciation works:
- For a business, buying long-term assets such as machines can cost a lot of money, but they help generate sales for a long time
- But the matching principle in accounting says to expense out costs in the same accounting period as the revenues they help generate.
- This means companies expense out only a part of what they pay for long-term assets each year. This is known as depreciating the asset.
- The number of years it takes to fully depreciate out an asset is called its useful life. Technically, the assets should be of no use after the useful life.
An asset’s useful life determines depreciation costs, though companies also choose how to depreciate over time (straight line = same amount every year, accelerated = front-loaded, and so on).
Here’s the problem: managers have significant leeway to determine useful lives, which gives them room to fudge profits.
Let’s say three companies ‘A’, ‘B’, and ‘C’ in the same industry, each buy a new ₹1,000 crore machine. Also, assume the maker builds the machine with an expected life of 10 years, after which the machine dies.
- ‘A’ considers useful life of the machine as 10 years.
- ‘B’ and ‘C’ considers useful life as 12 years
- When the machine dies, ‘B’ pretends its still in use and continues to depreciate it.
- ‘C’ writes off the machine when it dies, and incurs an impairment loss. Why? Perhaps pesky new auditors refuse to sign off, or new management don’t want to deal with unresolved issues from the past.
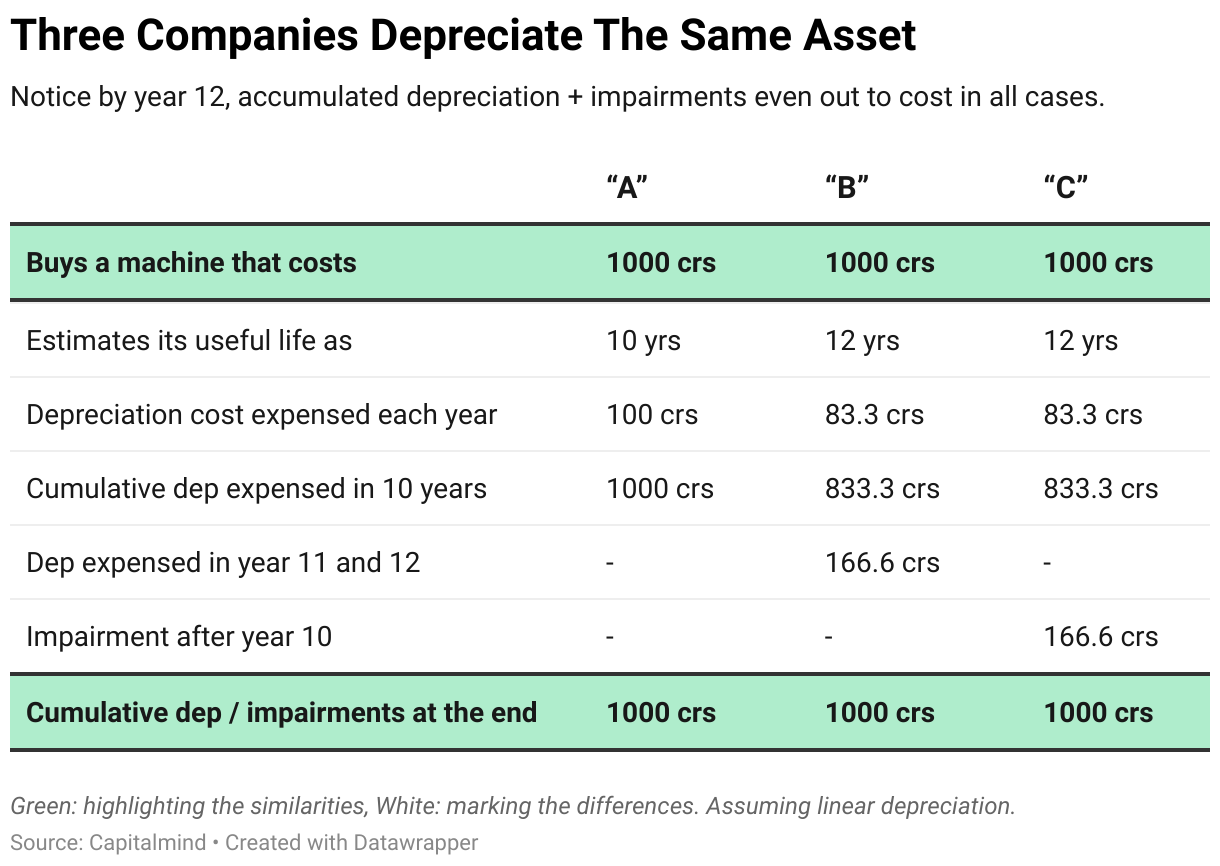
‘A’ fully depreciates the asset in ten years.
The impact evens out over time – ‘B’ depreciates the machine for two years longer, while ‘C’ takes a loss.
But in the first ten years, ‘B’ and ‘C’ depreciate the machine at 83.3 crs a year, inflating their profits compared to ‘A’.
Clearly, companies like ‘A’ are more accurate in reporting their numbers. Companies like ‘B’ see worse performance in Year 11 and 12 as they continue to depreciate a machine that produces nothing. Companies akin to ‘C’ may “suddenly” see impairments or “exceptional losses”.
The question we’ll ask is: do markets see through companies like ‘B’ and ‘C’ and rate them accordingly?
Note: in theory, rules require companies to test assets for impairment regularly. However, here too managers have considerable wiggle room.
Clues to spot stretched asset lives
You might be wondering how to identify companies likely stretching asset useful lives. Although rules require companies to report indicative useful life estimates, often these are not so useful:

Here’s a workaround to calculate a company’s useful life of its whole asset base:

This is simply the inverse of the company’s depreciation rate on its gross fixed assets.
There’s a caveat here: companies with significant amounts of old assets will have an unfair impact. Such companies will have fully depreciated older assets, and will depreciate based on new assets. But the older assets remain on the books as gross fixed assets.
Subsequent mentions of useful lives refer to these rather than reported equivalents.
Useful lives – A good metric to filter out companies?
The plot below shows the correlation between ‘useful lives’ for all companies across years, and each instance’s forward one-year returns.
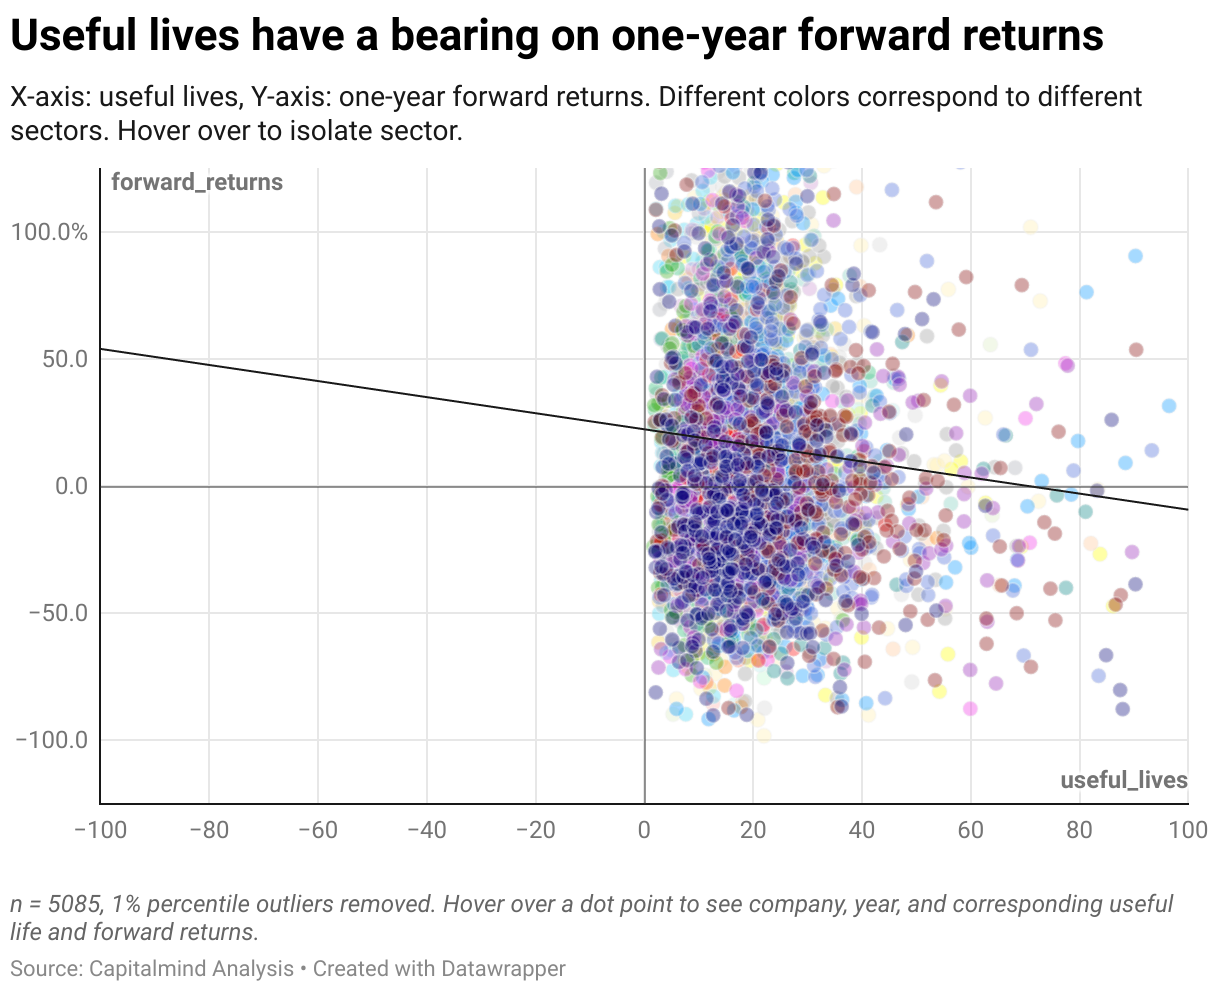
The dot points are scattered. However, the regression line, shows a correlation between useful lives and forward returns.
The steeper the line, more linear the relationship.
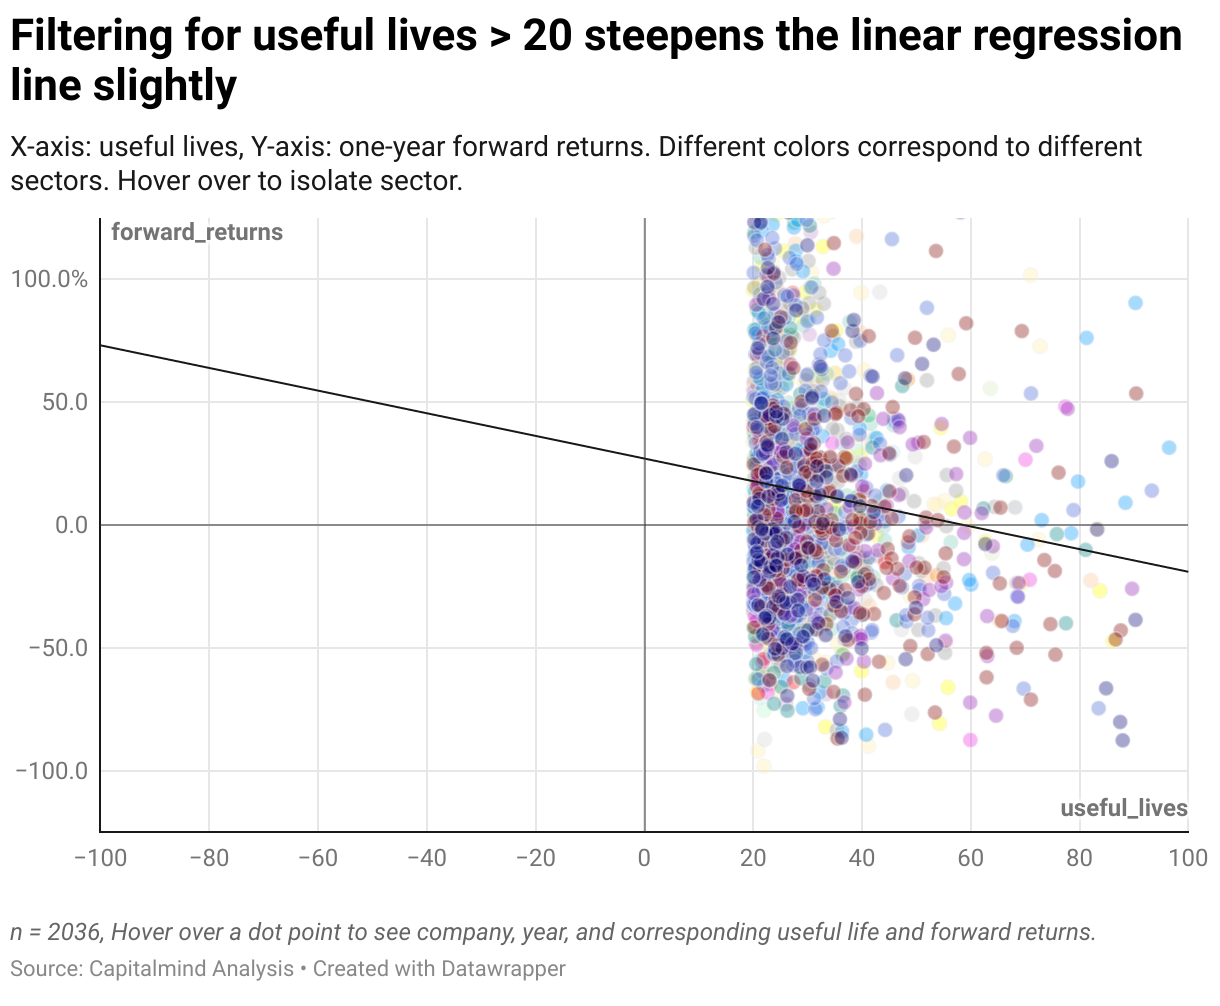
Filtering for instances with useful life higher than 20 years (or, depreciation rate lower than 5%) slightly steepens the line:
One way to decisively assess if markets punish higher levels of useful lives is:
- We divide NSE-500 (ex-financials) into distinct ranges of useful lives each year.
- We evaluate the average returns for each bucket, and compare them. This is equivalent to building a portfolio of all companies in each bucket in equal weights and evaluating each portfolio’s return.
- Companies report financial year numbers within a few months of March 31. So, we will use July as a starting date for calculating returns.
Reading the plot below: each bar chart represents a useful life range. Inside each chart, the X axis represents the year, while the Y axis shows how much stocks returned on average minus the NSE-500 return (“alpha”).

What the data tells us
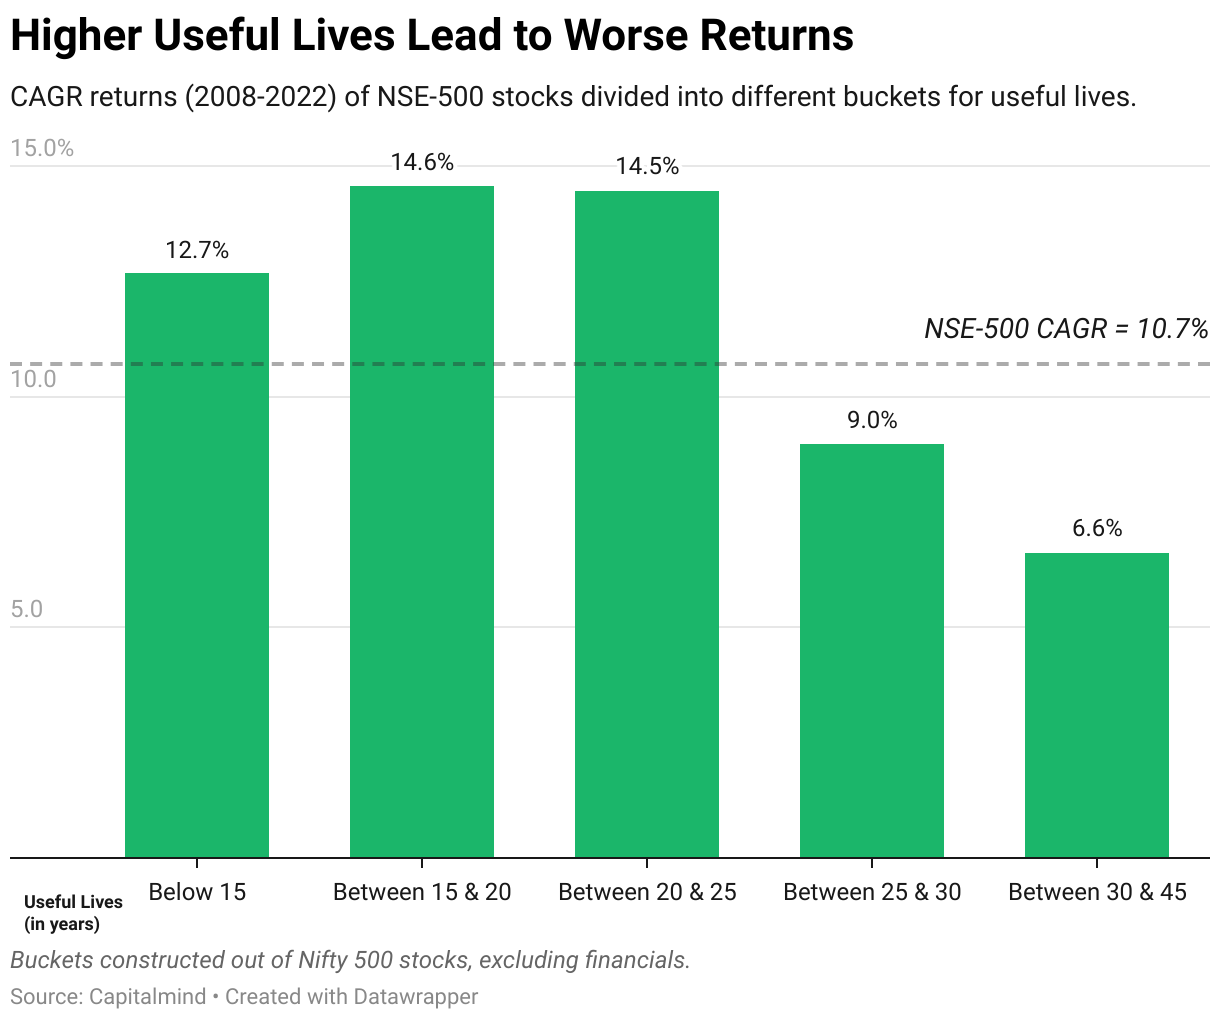
Beyond ‘useful lives’ over 25 years, average returns fall behind the Nifty 500 significantly.
For each bucket, average returns for each year, and compounded returns over fourteen years are shown in the table below.

Clearly, buckets with ‘useful lives’ exceeding 25 years have significantly lower returns CAGR over the fourteen-year period.
We’re not arguing that investing in companies with high useful lives is always a bad decision. But keep in mind that you’ll be betting against the odds. So when you are, dig deeper and find out why the company has a high useful life.
Cautionary tales
Hey, we get it. Data is hard to learn from. Stories are more memorable.
While conducting our analysis, we came across a few edge cases with write-offs that can serve as cautionary tales.
Alok Industries
In 2019, Reliance Industries and JM Financial together bid for a then-insolvent Alok Industries. Once the new board and management team took over in FY21, investors faced a stunning shock.
Alok recognized an enormous impairment loss of ₹8,264 crores as an exceptional item. “Exceptional” probably underplayed the situation.
Were there any warning signs?
- In 2017, Alok Industries had an estimated total useful life of 31 years—nearly twice the peer set, which averaged 16 years. Revealingly, this was also nearly 50% higher than the preceding year.
- In practice, it may be useful to check the longer-term trend. Between FY17-21, Alok’s depreciation rate averaged 3.8%, while the peer set averaged 6.2%.
All in all, Alok wrote off nearly 9,000 crores, most of it after it went bankrupt.
JSW Ispat Special Products
The steel industry’s general downturn worsened the company’s (then-known as Monnet Ispat) inability to service its massive debt. Consequently, lenders seized over half of Monnet’s stake and took it to bankruptcy court.
Read: The Bankrupt Companies in NCLT May Revive, But You Still Lose: Monnet Ispat Edition
Following the bankruptcy proceedings, a third-party assessment of Monnet’s books led to an impairment loss of ₹3,915 crores.
Impairment of fixed assets accounted for nearly ₹2,430 crores of this amount.
Foreseeable? A look at it’s useful life could have clued us in.
- In FY15, Monnet had a total useful life of 48 years, roughly 44% higher than the peer set average.
- During FY15-19, Monnet’s depreciation rate averaged 3%, about 20% lower than the peer set during this period.
All things considered, Monnet wrote off 2,600 crores of fixed assets in this period. That was roughly a third of its gross fixed assets.
Electrosteel Steel
In another bankruptcy example, Electrosteel incurred an impairment loss of approximately 5,100 crores in FY18, almost equal to its market cap at the end of the financial year.
As part of an insolvency resolution process, Vedanta took over the company soon after.
Read: Banks Take a Hit, Shareholders Take a Bigger Hit: Electrosteel Steels Edition
Was it possible to see the write-off coming?
- In FY14, the company’s assets had a ludicrously long useful life of 158 years, more than 2.5x the peer set average of 50 years.
- As a result, the company’s depreciation rate was just 60 basis points (0.6%) that year.
- Over FY14-18, Electrosteel’s depreciation rate averaged 2.5%, about 25% lower than the peer set.
The Last Word
Companies might reveal a higher useful life for fixed assets, to take a lower depreciation impact in early years. This can lead to exaggerated profits, bloated balance sheets and write-offs.
The factor to consider is: Is useful life much higher than the industry? If so, why?
Be careful, though. There’s a good chance that some elements are entirely explainable. For example, for a company that has aggressively depreciated in earlier years, the actual depreciation in later years may be lesser.
However, a useful life number that is a little too high and inexplicable can mean you are sailing against the wind. Given that the market, on average, dislikes companies whose assets have a useful life of 25 years or more, you might be better off avoiding the “stretchers”.
Further reading:
Fundas : Financial Shenanigans Part 1: Manipulating Revenues
Fundas : Financial Shenanigans Part 2: Manipulating Expenses
Fundas : Financial Shenanigans Part 3: Manipulating Cash Flows
Fundas : Financial Shenanigans Part 4: Key Metric Shenanigans
Fundas: Financial Shenanigans Part 5: Acquisition Accounting