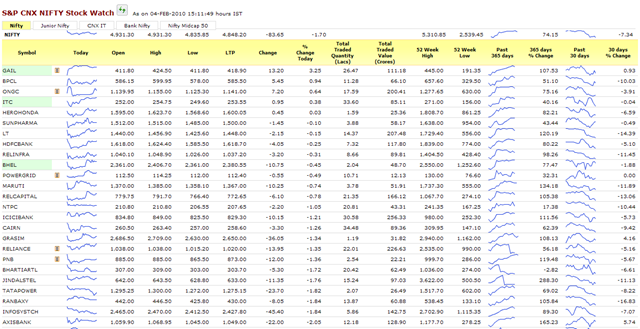
A neat new feature on the NSE home page is the Stock Watch feature:
It shows you all stocks in some indices (Nifty, Junior Nifty, CNX IT, BankNifty and Nifty Midcap 50) with intraday mini charts, trade details, and monthly/weekly movements. It even marks stocks close to 52 week highs/lows, and shows stocks with corporate actions with a little icon. One missing is sortable columns; the other, and potentially major pain point is that they don’t adjust the mini-charts for bonuses and splits – note the little bump down in the Reliance Stock in the mini chart, around November; that didn’t happen, it was a 1:1 bonus.
The NSE Site has been rapidly improving and I’m watching closely. But they are staying IE only for some of the features like TAME-Lite and Market Maps, which is quite unfortunate.
Update: Alert reader Saravanan Jayachandran points out that some columns are indeed sortable – like “% Change today”, “Symbol” and “365 days % change”, though it could be more intuitive. (Thanks!)


