Capitalmind
Capitalmind
Actionable insights on equities, fixed-income, macros and personal finance Start 14-Days Free Trial
Actionable investing insights Get Free Trial

794 ArticlesCharts & Analysis

25 / 80

We Did Not Tell You So. We Had No Idea This Would Happen.

This is what happened to the market today: While it’s apparent now that on twitter everyone knew this was coming and were well prepared for this years in ...

India's Manufacturing PMI at 15 Month Low, Contracts For the First Time Since Oct 2013

The Nikkei Indian Manufacturing Purchasing Managers Index (PMI) has fallen to a 15 month low in December 2015, plunging to way below the 50 line that marks the ...

5 Charts in the RBI Financial Stability Report That Might Shock You

Here’s Five Charts in the RBI Banking Financial Stability Report that are worth a look: 1. India Was Biggest Hit in 2013’s “Taper ...

Domestic Airlines Report Card for November 2015

We bring to you the “Domestic Airlines Report Card” for the month of November, 2015. We take a look at the Number of Passengers carried, Market Share of ...

Charts: India’s Current Account Deficit at -1.6% of GDP, But Worry Is Slowing Fund Flows From Abroad

India’s Current Account Deficit is at -1.6% of GDP as it comes in at -8.2 Billion Dollars for the quarter ended in September. This has been a rising ...

Charts: Nifty Hugely Underperforms Mid and Small Caps Since October

What’s interesting in the last two months has been the massive outperformance of the small caps over the index. Even as the Nifty has recovered from, ...

Charts: India's Foreign Trade Contracts Severely at -28% But The Base Effect May Wear Off From Next Month

The worldwide slowdown is quite real, apparently, as India’s imports and exports contract substantially over the last November. However, this might be ...

Charts: The Nifty Sees The Lowest Monthly Volatility Ever, And Very Few "Rip Your Face" Rallies

What we have been seeing is the market going steadily down or up. A 1% move is considered “big” nowadays. But it’s not really big, is it? The ...
NiftyBigDays_thumb.png

Chart: CPI Inflation for Nov 2015 at a 13-month High of 5.41%

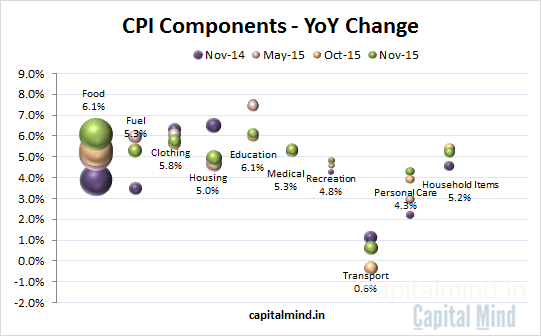
Consumer Price Inflation for November 2015 came in at a 1 year high of 5.41%, riding largely on the back of high food inflation. Here’s the situation in ...
CPIComponentsHighFoodInflation_thumb.png

The Nifty Has Fallen, But the P/E Ratio is at a Relatively High 20 While Earnings Contract

Just as the market breaks into a low, we revisit the price-to-earnings chart of the Nifty. Earnings are falling – by more than 5% over last year at this ...