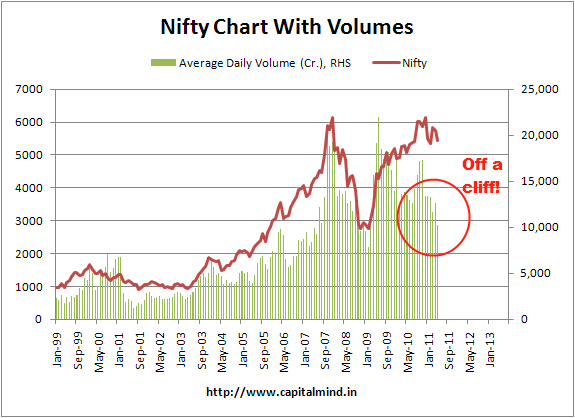
The Nifty volumes of late have been depressing. Here’s the ultra long term volume chart:
The Chart shows Average Daily Volume in terms of Total Traded Value on a Monthly Nifty Chart. The Average Daily Volume in May, till now, is a miserable 10,000 crores. Look at the chart closely:
Average Daily Volumes are the lowest since, hold your breath, Feb 2009.
This is not good. And this is on the back of many more listings and securities traded.
But you might say, listen Deepak, you are taking the Total Traded Value. If Nifty is high, the prices of securities is higher, and if someone always buys 100 shares of something, then the amount he pays is higher when Nifty is high and lower when Nifty is low?
This logic makes partial sense, at least to traders. Many people buy 1000 Nifty futures (20 lots of 50 each) regardless of where the Nifty is. Much of the action in the cash market is because of hedging against what is in futures. So yes, that logic does apply, to some extent.
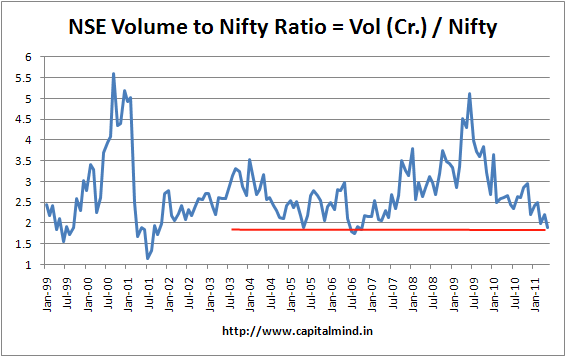
So let’s see the Volume-Nifty Ratio. This is the ratio of the NSE Volumes in Crore to the Nifty value. It is not useful in isolation, but it is useful to see if there is a trend in the overall movement and position of this ratio relative to the past.
We are at the lowest since 2006 (when the Nifty fell 30% after the RPL listing and when NSE increased margins). Before that, this kind of ratio was only in 2001!
The ratio usually bounced off these levels, but remember, this ratio can increase if the volumes stay the same and the Nifty drops. The one thing that an increase in this ratio CAN point you to, is an increase in volatility. A straddle or a strangle – buying a put and a call – is likely to be useful. But I would wait for the break of the technical figure of 5400 on the downside before initiating the position.
The lack of volumes are a reflection of lack of investor interest. We’ll check on the DII/FII/Retail investor interest in another post, but overall volumes are quite disappointing.


