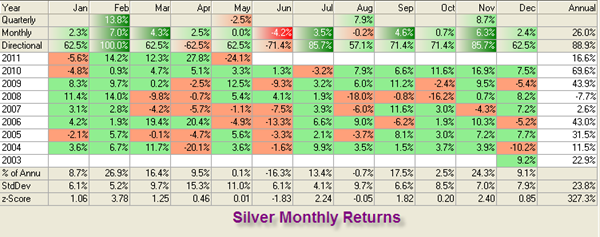
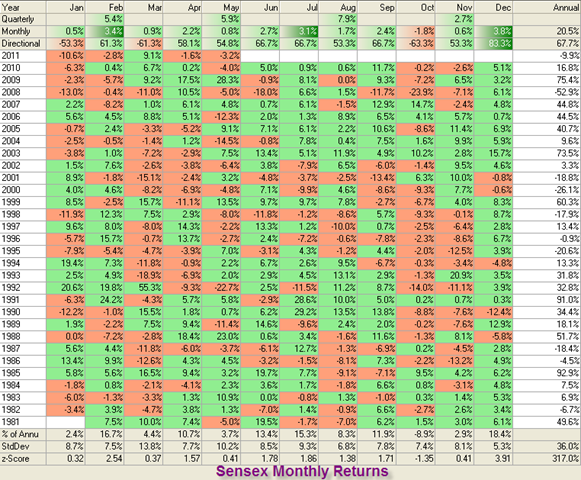
I got this as an email from Mr. Prakash Kamath, on a group I’m on. A graph containing the monthly Sensex, Gold and Silver changes over a long time.
Silver Returns Since 2003:
Gold Returns Since 2003:
Sensex Returns Since 1981:
I then decided to build my own looking at the Sensex and Nifty data, but I don’t have Sensex Data going back all the way to 1981 (only since 1991). And Nifty data since 1994, so here we go:
Nifty Monthly Returns Since 1994:
Turns out May is a highly volatile month – the highest standard deviation (10.9%) has happened here. And why not? In May 2004, the index fell to the lower circuit because of the BJP being voted out. In May 2009, the Congress stayed and the Left was out, so the index went to the upper circuit. In 2006, there was a 30% crash in May after the RPL listing. I don’t remember 1998 or 1999 but those were also down and up Mays.
December looks like a wonderful time to invest – just one occasion for the Nifty since 1994 that the index had negative returns; an average of 5% with an SD of 4.7%. Even on the Sensex we’ve had negative returns in December just five times.
Average Growth Rates
Since 1991, the CAGR of the Sensex to April 2011, a 20 year period, is 15.42%.
Since 1994, the Nifty’s CAGR from 1083 to 5551, is a miserable 10.11%.
Remember that when people show you 25% growth rates for equity in a long term chart.


