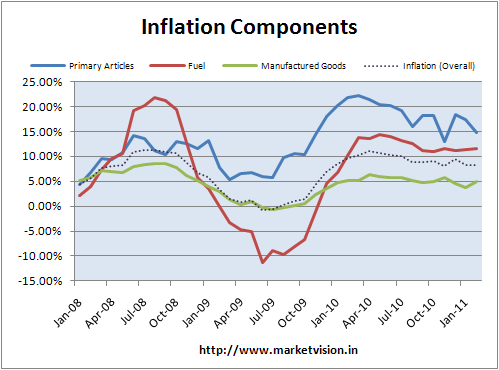
February 2011 Inflation came in at 8.3%, with a pick-up in manufacturing goods. I had written earlier that the danger remains of inflation moving from primary items to secondary items and now that seems to be happening.
At MarketVision we have created a Visualization of Inflation in India. The idea is to look at where components seem to be showing high inflation. You can click to zoom in and right-click to zoom out. The boxes are sized according to their weight in the inflation index, and coloured according to inflation in that component (y-o-y).
So overall inflation looks like this.
Food Inflation slowing down, but not *that* important.
You’ll note that while we give a lot of importance to food, it’s about 25% of the index (Food Articles plus food products). In comparison, chemicals and metals add up to 22%! We should be worried about inflation sneaking up in those parts as well.
Manufactured Products Picking Up
Manufactured products – 65% of the overall index – is up 4.90% after going below 4% last month. Look at the individual component chart:
Cotton, Silk, Rubber and Timber Alert
These are the red-hot items in February. Figures in brackets are inflation numbers.
Cotton and Silk prices will flow to the readymade garments (part of manufactured goods, textiles) in the coming months. Watch how the manufactured side of the business is starting to perk up, but it’s not there yet, with cotton textiles at 19.2% inflation:
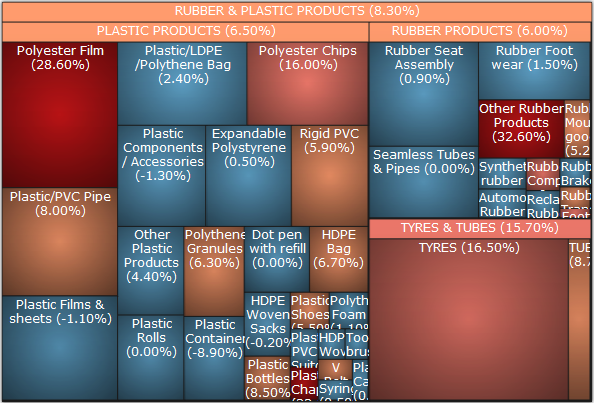
With Japan’s crisis, worldwide timber costs will go up. And buy tyres now – raw rubber costs are going up. That will eventually translate to the manufactured items too.
Fuels: Coal Prices Not Updated
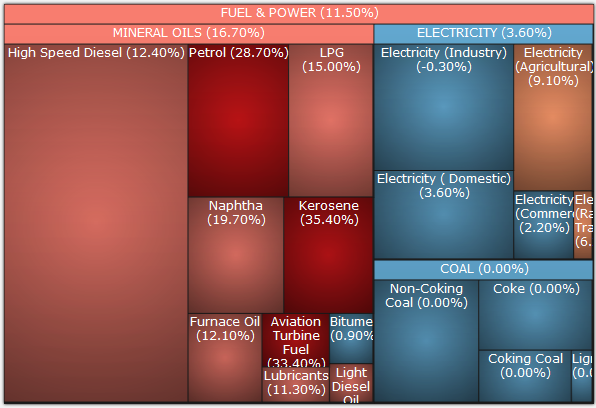
At the fuels level, we’re seeing a decent behaviour in utilities (electricity). But fuel oils is heating up.
However, they haven’t updated the price of the whole Coal subsystem for an entire year now. Coke prices are up sharply since the floods in Australia, but we aren’t seeing that reflected in the index. That is back to Indian Data Suckage.
Some interesting sub-items:
Polyester film prices have moderated a bit. Note how rubber is still benign in the manufactured items piece.
But before I go berserk pasting pieces, I encourage you to explore the Visualization of Inflation in India.
(Note: there are some issues with it going insane after a few minutes. We’re looking into it. Meanwhile, refresh the page if you hit the problem.


