Warning: Technical post (Repeated from the MarketVision blog)
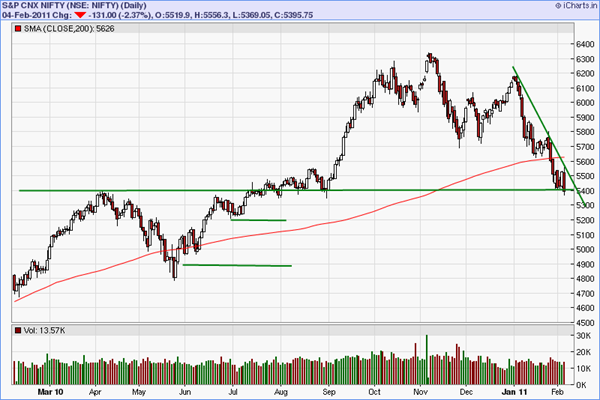
The 200-DMA setup went seriously against me – there was a slight attempt to take the 200 DMA again, in the morning, but the Nifty completely destroyed itself.
I exited around 5480, it didn’t look very good.
Where then are the longer term supports?
There’s some at 5200, and some more around the 5000/4900 levels. There is absolutely no reason to work
You can see that a head and shoulders pattern is emerging in the 1 year timeframe. It looks like we’ll go further down.
The Nifty ended below 5400 which is useful for the shorts. But what I might actually do is a strangle (5200 put-5400 call) because of a theory that regardless of what happens, we’re not staying here. That is of course just a theory, and you could offset the high premiums by writing, say, a 5000-5600 outer strangle and make this a Reverse Iron Condor. You might want to check your commissions before you do something of this sort. It might be useful to do this on individual stocks as well.
Indicators
The MACD turned negative in early Jan. Negative meaning red line crosses below the blue line (above the 0 level).
MACD hasn’t been a great indicator on the Nifty – backtests show that there are too many head-fakes, too much lag and in general unreliable on it’s own. But in combination with other indicators, it adds value – sorta like saying if all the planets are aligned we get a worthwhile setup. (Don’t take that as a thumbs up for astrology – I think that art is a great entertainer but nothing else.)
The RSI shows that we haven’t spent too much time being "oversold". I don’t believe in trading relative strength back to the other side – what is oversold can remain oversold for a long time in trending times. The only thing I can read here is that that downmove isn’t "overdone" by any means.
Indicators are only useful for so much – you can’t take many decisions purely on them.
Going forward, there seem to be much happening in individual stocks. More on them in separate posts.


