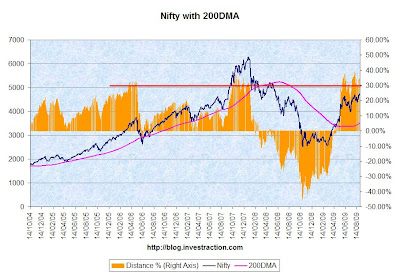
Looking at the Nifty with it’s 200 day moving average (200DMA) produces a story of extremes.
(Click for a larger image)
Distance % is the difference with respect to the 200DMA, or (Nifty-200DMA)/200DMA.
The index doesn’t seem to stay above the 30% distance (from the moving average) for very long; the last two times it hit the 30% mark, it took between three to six months for a crash of sorts. But in both cases, it wasn’t that the 200DMA rose to meet the index, the index crashed to come closer.
In 2006 there was a 30% crash in May-June, and the index was 30% away from it’s DMA for about three months. In 2007, the 30% mark was breached in October, and it stayed breached till the crash in Jan 08.
For a more longer term picture, since 1997:
(Click for a larger image)
The dips don’t look big (this isn’t a log chart). Still, the index does seem to dip 20% after it stays away from the 200DMA for over a few months.
As of August 31, the Index is at 4662 and the 200DMA is 3526. The Index is 32.21% away.


