
We manage two active portfolios that invest in long-term growth: Surge India in our portfolio management service Capitalmind Wealth, and Focused as part of our do-it-yourself offering Capitalmind Premium.
We believe India is perfectly placed to cash in on infrastructure improvements, booming consumer demand, import substitution, and surging financial sophistication.
As these trends unfold, our portfolios will continue to participate in India’s story by hunting for high-growth businesses aided by strong tailwinds.
In this post, we discuss how a quantitative approach to categorising growth coupled with high-quality insights can help build robust portfolios.

A Quick Recap On Why Growth Matters
Here’s a simple way to understand why growth is important. Let’s compare 3 sets of 15-year cash flows:
- No Growth: ₹100 every year for 15 years
- Inflationary: ₹100 growing at 5% for 10 years, then no growth for 5 years
- Real Growth: ₹100 growing at 15% for 10 years, then no growth for 5 years
Intuitively, the ‘Real Growth’ set would be the most coveted. Question is–by how much?
Since money today is worth more than money tomorrow, the table below shows the “present value” of these cashflows:

The inflationary growth set, just by keeping up with inflation for ten years, has a 30% higher worth than the no-growth set.
Meanwhile, the Real Growth cashflows are valued 1.8x times the inflationary growth set, and 2.3x times the no-growth set.
Simply put, all else being equal, a company that is likely to grow cashflows faster than inflation is worth 2.3x a company that is expected to keep them constant, i.e. no growth.
This shows the importance of growth, at least in theory. 15% growth, for 10 years can make a difference. In real-world investing, though, things aren’t as tidy as a spreadsheet outlining a company’s future cash flows.
Leveraging History for Expectations
As asset managers, we rate tangible data more than flashy forecasts. Instead of assumptions, we want quantitative insights to augment our approach.
One way we do this is by scrutinizing ideas through the lens of history. This outside view allows us to understand how the idea stacks up against long-term odds.
Say we identify a promising business that shows potential for growth above our 20% hurdle rate. Sounds great, but what are the odds it delivers? We would contend, looking at how similar stories panned out in the past can offer perspective.
Perhaps start with something as simple as
How many businesses even deliver high growth?

Reading this table: rows show growth rates, while columns show timeframes for growth. We would,
- find 20% or higher CAGRs in the left most column,
- then slide over to the right to the appropriate timeframes.
Okay, only one-in-five businesses manage to grow at high rates in a 3-year timeframe.
Wait-what about longer? Don’t most businesses grow for a long-time?
Let’s look at the distribution of revenue growth across different timeframes. X-axis here represents compounded growth bins, while the Y-axis shows percentage of companies.
We see normal distributions in each timeframe, with curves growing taller and clustering tighter to the middle (< 15% growth) on higher timeframes. Growth tends to revert to the mean, and exceptional growth is hard to sustain over long term.
Only one-in-eleven businesses maintain over 20% annualized growth for 10 years. As we saw earlier, the odds are better (one-in-five) over a 3-year span. Why not recalibrate expectations and prefer those odds?
Well, okay. But this company is in its early growth phase, with only about a 1,000 crores in revenue.
So we should really ask is, how many businesses of this size manage to pull off high growth?
Here, things get interesting. We are starting to sharpen our odds by factoring in the kind of story we are dealing with.
Let’s break down these “base rates” by different deciles of starting revenues. Today’s ₹1,000 crores is not the same as ₹1,000 crores in 2010, so we adjust starting revenues for inflation.

The baseline effect holds true here. It is easier to grow fast with a lower starting point: the odds go from 18% for the biggest companies to 28% for the smallest ones.
For our hypothetical 1,000 crore company, the odds improve to 1-in-4.
The takeaway is:
- We study how businesses have performed in the past.
- While not a perfect science, data-driven insights gets us ballpark odds of being right.
- When taking on the odds, we better have an outlier story grounded in reality.
Does Growth Investing Work In India?
Although backtesting fits systematic strategies more naturally, we have been leveraging it to test out different criterions we use in our discretionary portfolios.
Broadly, we backtested three growth constructs for earnings per share:
- A “naive growth” strategy chasing year-on-year growth rates. It outperforms Nifty, but with higher volatility and max drawdowns. Not the best approach due to one-offs and other temporary effects.
- A “long-term growth” approach, which uses 3-year median growth as a factor. It performs much better with lower max drawdown versus the benchmark. Volatility, and therefore Sharpe and Sortino ratios improve against the previous construct.
- A “prudent growth” approach that adds in a RoIC filter to the long-term growth strategy. This yields the best returns among the three constructs, with lower volatility and drawdowns than Nifty.

We’ll do a walkthrough of our process below. Fair warning: lots of numbers ahead.
Assumptions
First, here are a few assumptions baked into all 12 backtests we’ll see below:
- Starts in 2009.
- Bakes in a three-month lag to adjust for reporting delays.
- Rebalances once a year, first week in July.
- Ranks universe based on chosen growth construct.
- Buys top 30 ranking stocks in equal weights from this pool.
- Limits buys at 25% of a stock’s turnover every day, and sticks to positions that can be built within 10 days using past data.
Putting in these constraints simulates what a similar strategy might look like today.
The “Naive” Growth Approach
This is an unpolished approach which puts money in top 30 ranking companies, ranked by year-on-year EPS growth. It beats the benchmark by a decimal point, effectively meaning it doesn’t.
Worse, it has higher volatility and severe drawdowns. In three-year rolling periods, the strategy’s odds of outperformance are no better than a coin toss.

On a closer look at the strategy’s top losers, the diagnosis is fairly obvious.
It is picking businesses with optically high growth fueled by one-offs, low base effects, temporary windfalls, and accounting shenanigans.

This is also reflected in the portfolio’s average holding period of 420 days, meaning many portfolio companies did not make the cut for two consecutive years.
Thankfully, the prescription is as simple as the diagnosis.
The Long-term Growth Approach
We would want our strategy to invest in companies with a solid history of legitimate growth, not temporary flare-ups built on shaky foundations. So in this approach,
- Choosing a 3-year lookback period gives the backtest enough rolling windows for meaningful analysis.
- We use median growth rather than mean or CAGRs, which are less resilient to such flareups.
- We focus on the “interquartile range” (middle 50% values), stripping away outliers, and buy top ranking stocks from this pool.
These measures limit effect from short-lived mirages, and help the strategy buy durable growth worth betting on. It’ll also forgive a year of bad performance, though.
How does it fare?

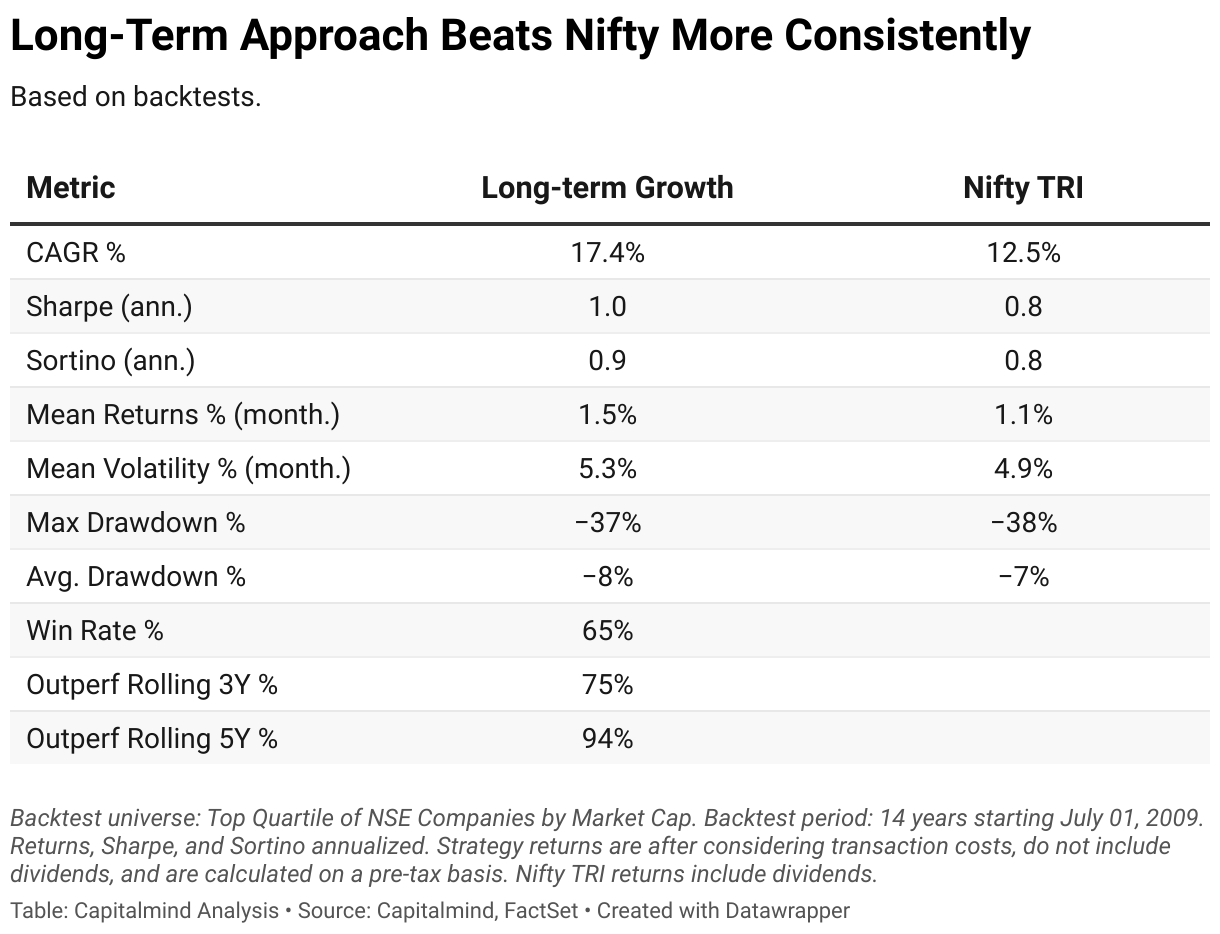
Clearly, this approach does a much better job at beating the Nifty.
What’s more, it delivered lower volatility than the year-on-year construct. This resulted in better risk-adjusted returns, reflected in a higher Sharpe compared to the benchmark.
But there’s still room for improvement here.
The “Prudent” Growth Approach
“The ideal business is one that takes no capital, and yet grows.”
Warren Buffett
Growth at all cost often backfires. Kingfisher Airlines, Amtek Autos, and Yes Bank are examples of companies that paid the price for growth-at-any-cost. In a prudent growth approach, we’d like to avoid companies of this sort.
ROIC is an all-rounder metric, but it is especially useful in understanding the level of growth a business can sustain without requiring loads of outside capital. High ROICs allow companies to be value accretive for shareholders, all while investing surplus money back into their business.
So in this approach, we rule out companies with 3-year median ROIC lower than 20%. From the remaining set, we still buy top 30 ranking stocks.
The prudent growth strategy beats Nifty TRI by a solid 6.2% CAGR. It does so with lower volatility, resulting in a commendable Sharpe of 1.1 (Nifty: 0.8), and a Sortino of 1.1 (Nifty: 0.8).

The strategy’s equity curve highlights consistent alpha generation, reflected by the widening gap between the strategy and Nifty:

On rolling periods,


The strategy experienced a lower max drawdown, but took a bit more time (660 days vs 629 days) to recover than the Nifty. On average, the strategy had slightly higher drawdowns, but recovered quicker (20 days vs 24 days).
As the drawdown curve shows, this strategy was yet to recover in July this year, even while the Nifty started making all-time highs.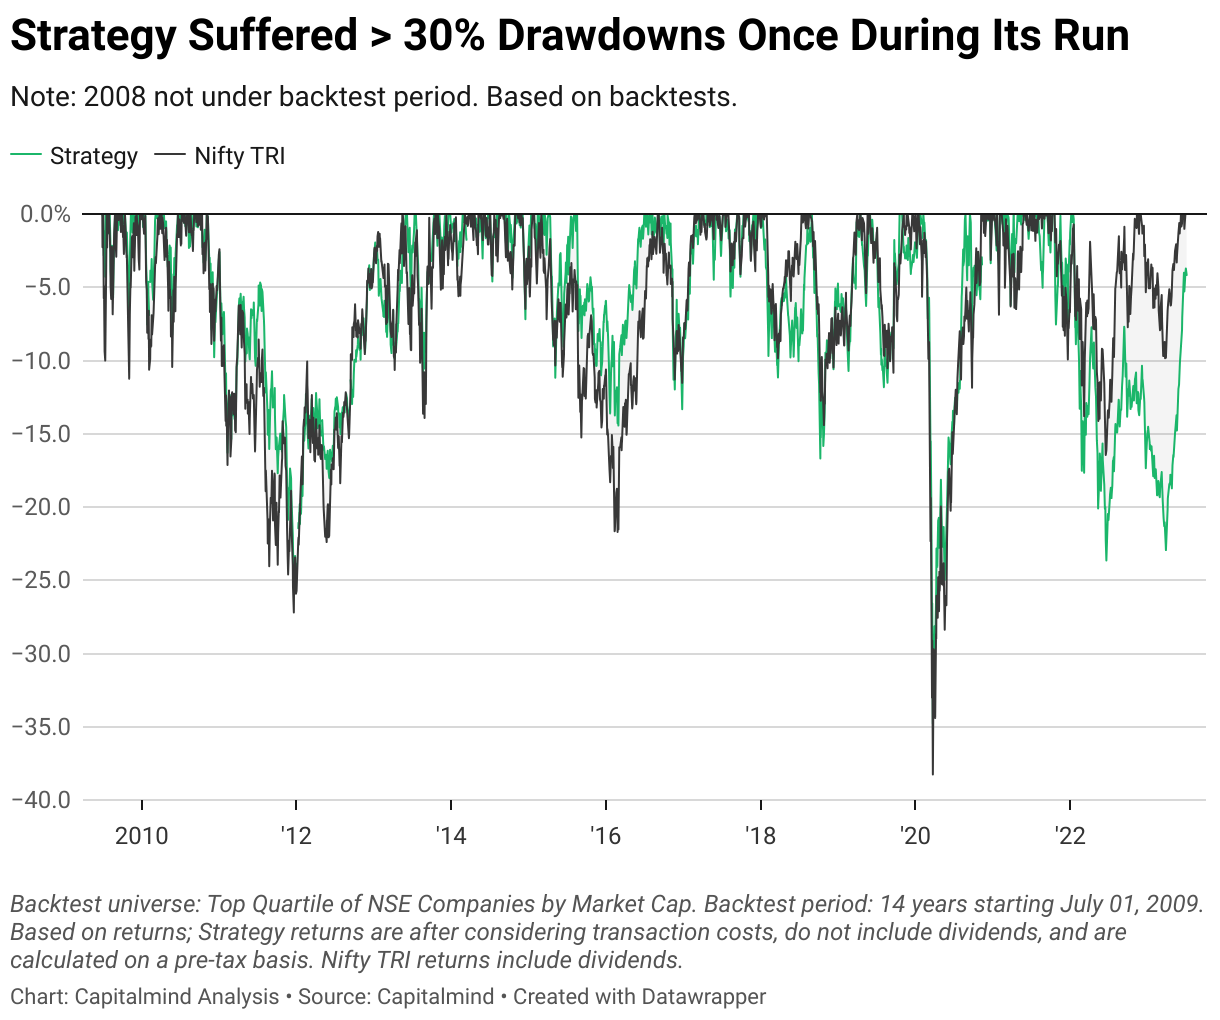

What the prudent growth strategy bought
The backtest shows a remarkable blend of 68% win rate and 3.4x payoff ratio, meaning two of three trades made money and an average winner returned thrice as much as an average loser conceded.
What’s more: over a span of 14 years, the strategy took just 208 positions, holding a stock for 660 days on average. This meant modest churn (0.6), and therefore low transaction costs (approx 0.16%).
Longer holding periods also indicate that once a company was bought based on past growth, it survived another selection cycle next year, meaning growth persisted.
Now, let’s peek under the hood and see what kind of businesses the strategy picked.
Here are the top winners, ranked by their contribution to profit (how much a position’s profits contributed to the strategy’s assets upon exit):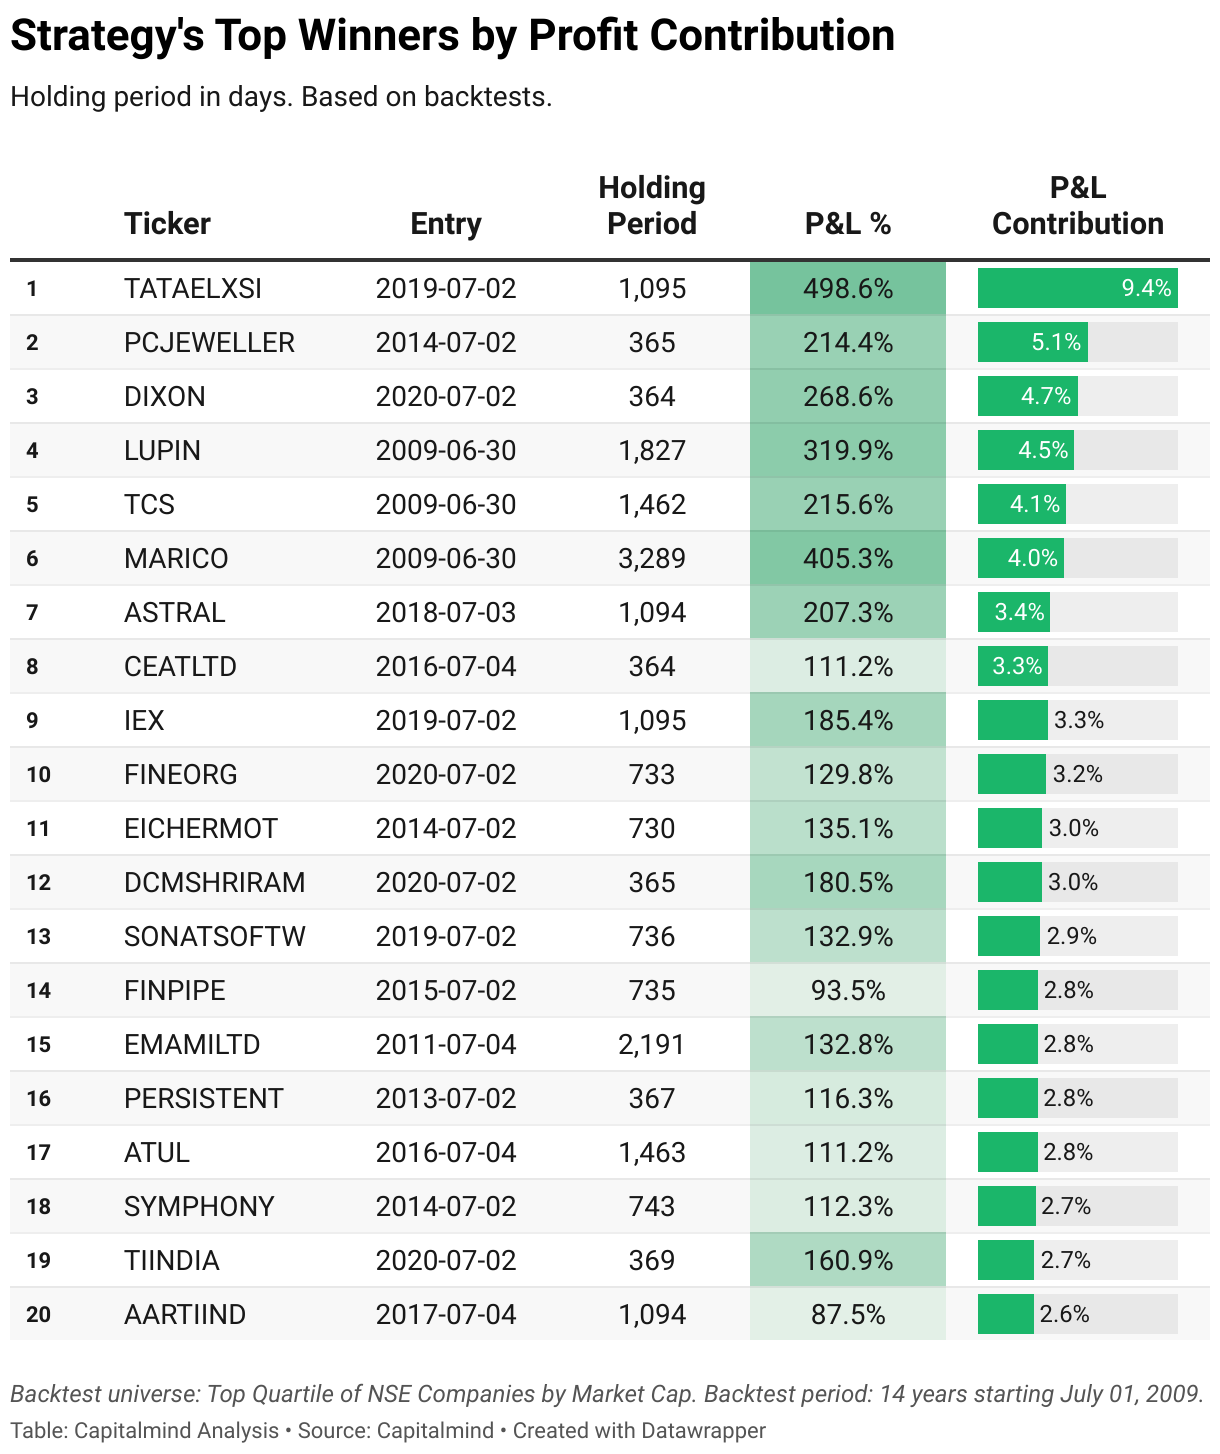

The strategy took some interesting positions:
- It first bought TATAELXSI at a price of 921/sh, and last sold it at 8152/sh. This could have been a nine-bagger in three years, but since the backtest bought and sold over multiple days due to liquidity, it realizes a six-fold increase. Serves as a reminder of how things can get tricky even if you have your pick right.
- MARICO was held for 9 years straight. Again, a nine-bagger from first buy to last exit price.
- PCJEWELLER slipped through, despite the constraints. Of course, we have a hindsight of issues not evident at the time, as highlighted by screenshots below.

Did we get lucky?
Our backtesting framework is path-dependent. We can tweak it to see how the strategy would fare if we removed top winners from the consideration set. This way, we can ensure the performance isn’t riding on a handful of lucky picks.
We see a dip in performance, but the strategy still holds its own. This reaffirms the construct’s robustness as an approach for investing in growth.

But here’s where it did miss its mark:

Six healthcare related names, somehow. A few cyclical names, perhaps avoidable by discretionary calls. A few names unheard of, highlighting the death-spiral nature of growth companies.
Also, interesting to see common stocks such as LUPIN and FINPIPE make both the winners and losers lists.
Are these backtests fragile?
We understand backtests tend to be sensitive to underlying assumptions. Therefore, we run our analysis under many conditions to determine the robustness of a strategy.
Let’s explore some variations of the prudent growth strategy, to see how it weathers under different assumptions.
First, let’s swap our growth metric from earnings per share with two other commonly used measures: revenue and Ebit (operating profits).
- The Ebit strategy manages to beat the benchmark, but lags the other two strategies.
- Between revenue growth and EPS growth strategies, performance varies negligibly.

We consider EPS growth instead of revenue growth with win rate as a tiebreaker, though the difference in performance is minor.
A key lever in this strategy is the minimum ROIC level required to make the cut. Here’s what we observed: high ROIC thresholds kept volatility and severe drawdowns at bay, boosting risk-adjusted returns.
More notably, the inverse strategy picking stocks with lower ROIC (shaded crimson red), falls short versus other variants and the Nifty. This validates that growth at all costs tends to be value-destructive for shareholders on average.

We are interested in testing growth as a strategy, so we chose the baseline ROIC beyond which incremental benefits can safely be missed out.
We can also change the maximum holdings in our strategy.

While the differences between 30 and 40 stock portfolio are minute, our decision to stick with 30 stocks for the backtest was quite straightforward.
We wanted to avoid the potential pitfall of not finding enough qualifiers, leading to cash drag. While this issue didn’t arise in the backtest, we played it safe.
The backtest also shows a concentrated 20 stock growth portfolio delivers higher returns with minimal impact on Sharpe. It’s also worth remembering these are equal-weighted portfolios. Concentrated strategies likely do better with position sizing.
Summing up the backtests, growth investing does work in Indian markets. However,
- There’s little to gain from forecasting, when you can buy into growth and still make money.
- Steer clear from temporary flareups. They do more harm than good.
- Look for endurable, or value accretive growth. This can be a ROE/ROIC filter, or whatever works for you.
Wrapping up with key takeaways
- With Mahatrends playing out, India offers, as it has in the past, alpha for investing in growth.
- Our game plan for India’s growth story is backed by data-driven insights and quantitative data.
- We explored base rates and backtests as tools to understand what has worked for growth investing in Indian markets.
- Hopefully, we answered why we have a 3-5 year timeframe, what makes betting on smaller companies worthwhile, why we concentrate within top 20 stocks in a 30 stock portfolio, and why a ROE/ROIC filter helps steer clear from bad investing outcomes.
Want to know more? We recently hosted a webinar on Surge India: Invest in Maha-trends of Indian Economy
Like how we think about investing? Reach our team here to invest with us.